Note
Go to the end to download the full example code
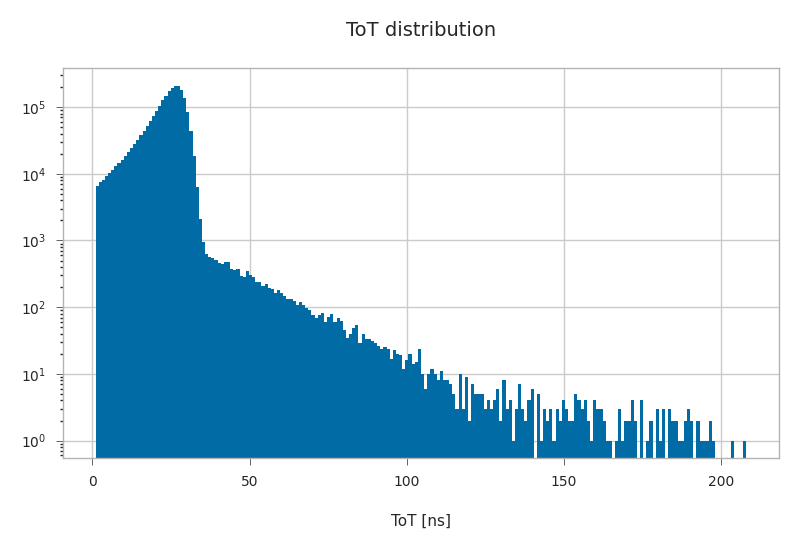
ToT histogram.
Create a simple histogram of the PMT signals (ToTs) in all events.
# Author: Tamas Gal <tgal@km3net.de>
# License: BSD-3

import tables as tb
import matplotlib.pyplot as plt
import km3pipe.style
from km3net_testdata import data_path

km3pipe.style.use("km3pipe")

filename = data_path("hdf5/atmospheric_muons_sample.h5")

with tb.File(filename) as f:
    tots = f.get_node("/hits/tot")[:]


fig, ax = plt.subplots()
ax.hist(tots, bins=max(tots), log=True, edgecolor="none")
ax.set_title("ToT distribution")
ax.set_xlabel("ToT [ns]")

fig.tight_layout()
plt.show()
Total running time of the script: (0 minutes 0.695 seconds)