Note
Go to the end to download the full example code
PMT Directions
Plot the PMT directions for a given DOM.
# Author: Tamas Gal <tgal@km3net.de>
# License: BSD-3
from mpl_toolkits.mplot3d import axes3d
import matplotlib.pyplot as plt

from km3net_testdata import data_path

import km3pipe as kp
import km3pipe.style

km3pipe.style.use("km3pipe")
km3pipe.style.use("talk")

detx = data_path(
    "detx/orca_115strings_av23min20mhorizontal_18OMs_alt9mvertical_v1.detx"
)
det = kp.hardware.Detector(detx)
Detector: Parsing the DETX header
Detector: Reading PMT information...
Detector: Done.
Alternatively, you can use the det_id to retrieve the geometry from the DB.
# det = kp.hardware.Detector(det_id=29)
Let’s take the first DOM ID
dom_id = det.dom_ids[0]
…and get the table of the PMTs in the chosen DOM:
The quiver function can directly plot the PMT data, since those are stored as numpy arrays.
fig = plt.figure()
ax = plt.axes(projection="3d")

ax.quiver(
    pmts.pos_x, pmts.pos_y, pmts.pos_z, pmts.dir_x, pmts.dir_y, pmts.dir_z, length=0.1
)

ax.set_xlabel("x [m]")
ax.set_ylabel("y [m]")
ax.set_zlabel("z [m]")

ax.set_title("PMT directions on DOM {}".format(dom_id))
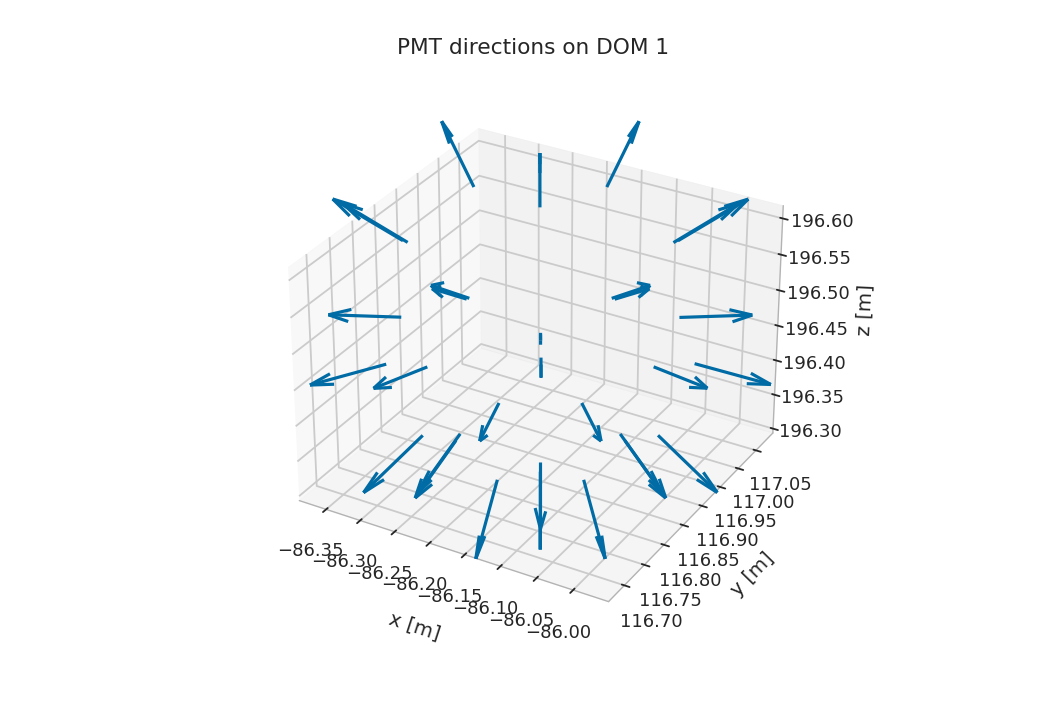
Text(0.5, 1.0, 'PMT directions on DOM 1')
Total running time of the script: (0 minutes 0.678 seconds)