Note
Go to the end to download the full example code.
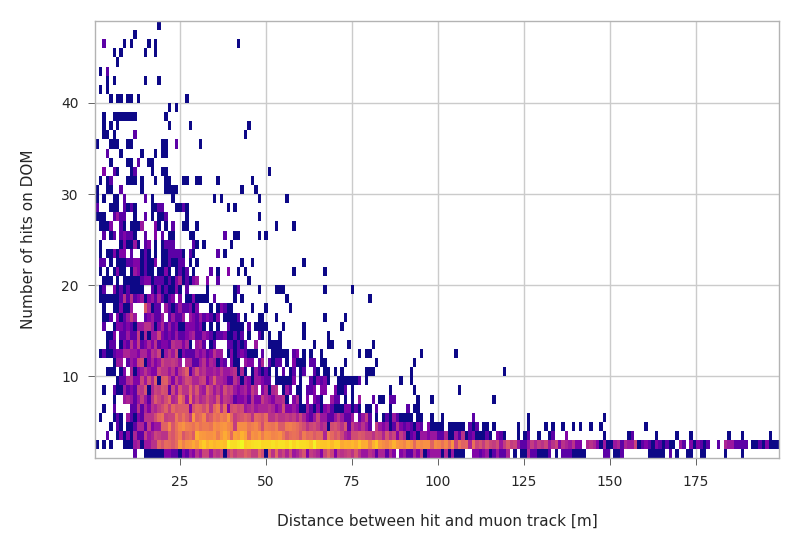
DOM hits.
Estimate track/DOM distances using the number of hits per DOM.
Detector: Parsing the DETX header
Detector: Reading PMT information...
Detector: Done.
Pipeline and module initialisation took 0.015s (CPU 0.015s).
--------------------------[ Blob     100 ]---------------------------
--------------------------[ Blob     200 ]---------------------------
--------------------------[ Blob     300 ]---------------------------
--------------------------[ Blob     400 ]---------------------------
--------------------------[ Blob     500 ]---------------------------
================================[ . ]================================
       n_hits    distance
0           1  102.049055
1           2   91.942233
2           2  837.073030
3           2   41.469520
4           3   30.938144
...       ...         ...
10028       4   35.125770
10029       2   72.235454
10030       2   51.261673
10031       1   55.623002
10032       2   61.987838

[10033 rows x 2 columns]
============================================================
500 cycles drained in 3.830241s (CPU 6.138647s). Memory peak: 707.86 MB
  wall  mean: 0.007488s  medi: 0.004041s  min: 0.001873s  max: 1.636669s  std: 0.072949s
  CPU   mean: 0.007488s  medi: 0.004042s  min: 0.001874s  max: 1.636555s  std: 0.072944s

Blob([('HDF5Pump', None), ('StatusBar', None), ('DOMHits', None)])
# Author: Tamas Gal <tgal@km3net.de>
# License: BSD-3

from collections import defaultdict, Counter

import numpy as np
import pandas as pd

import matplotlib.pyplot as plt
from matplotlib.colors import LogNorm

import km3pipe as kp
from km3pipe.dataclasses import Table
from km3pipe.math import pld3
from km3modules.common import StatusBar
from km3net_testdata import data_path
import km3pipe.style

km3pipe.style.use("km3pipe")

filename = data_path("hdf5/atmospheric_muons_sample.h5")
cal = kp.calib.Calibration(filename=data_path("detx/KM3NeT_-00000001_20171212.detx"))


def filter_muons(blob):
    """Write all muons from McTracks to Muons."""
    tracks = blob["McTracks"]
    muons = tracks[tracks.type == -13]  # PDG particle code
    blob["Muons"] = Table(muons)
    return blob


class DOMHits(kp.Module):
    """Create histogram with n_hits and distance of hit to track."""

    def configure(self):
        self.hit_statistics = defaultdict(list)

    def process(self, blob):
        hits = blob["Hits"]
        muons = blob["Muons"]

        highest_energetic_muon = Table(muons[np.argmax(muons.energy)])
        muon = highest_energetic_muon

        triggered_hits = hits.triggered_rows

        dom_hits = Counter(triggered_hits.dom_id)
        for dom_id, n_hits in dom_hits.items():
            try:
                distance = pld3(cal.detector.dom_positions[dom_id], muon.pos, muon.dir)
            except KeyError:
                self.log.warning("DOM ID %s not found!" % dom_id)
                continue
            self.hit_statistics["n_hits"].append(n_hits)
            self.hit_statistics["distance"].append(distance)
        return blob

    def finish(self):
        df = pd.DataFrame(self.hit_statistics)
        print(df)
        sdf = df[(df["distance"] < 200) & (df["n_hits"] < 50)]
        bins = (int(max(sdf["distance"])) - 1, int(max(sdf["n_hits"]) - 1))
        plt.hist2d(
            sdf["distance"], sdf["n_hits"], cmap="plasma", bins=bins, norm=LogNorm()
        )
        plt.xlabel("Distance between hit and muon track [m]")
        plt.ylabel("Number of hits on DOM")
        plt.tight_layout()
        plt.show()


pipe = kp.Pipeline()
pipe.attach(kp.io.HDF5Pump, filename=filename)
pipe.attach(StatusBar, every=100)
pipe.attach(filter_muons)
pipe.attach(DOMHits)
pipe.drain()
Total running time of the script: (0 minutes 9.277 seconds)