Note
Go to the end to download the full example code
Sphere Cuts
This example shows some spher(ical) cuts on a set of points in 3D
using kp.math.spherecut and kp.math.spherecutmask.
import km3pipe as kp
import matplotlib.pyplot as plt
import numpy as np
Generating a few points randomly distributed in a cube
points = np.random.rand(1000, 3)
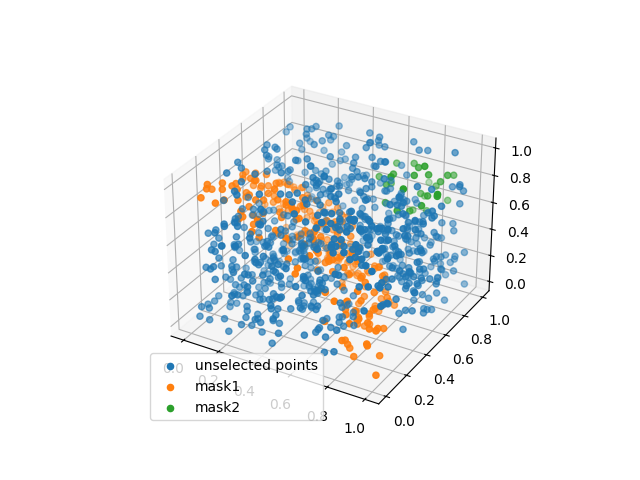
In this example we create two masks and use them to not only highlight the selected points but also to hide those from the original dataset.
mask1 = kp.math.spherecutmask([0, 0, 0], 0.8, 1.0, points)
mask2 = kp.math.spherecutmask([0.8, 0.8, 0.8], 0, 0.2, points)

fig = plt.figure()
ax = plt.axes(projection="3d")
ax.scatter(*points[~(mask1 | mask2)].T, label="unselected points")
ax.scatter(*points[mask1].T, label="mask1")
ax.scatter(*points[mask2].T, label="mask2")

ax.legend()
<matplotlib.legend.Legend object at 0x7f4cd3d99e80>
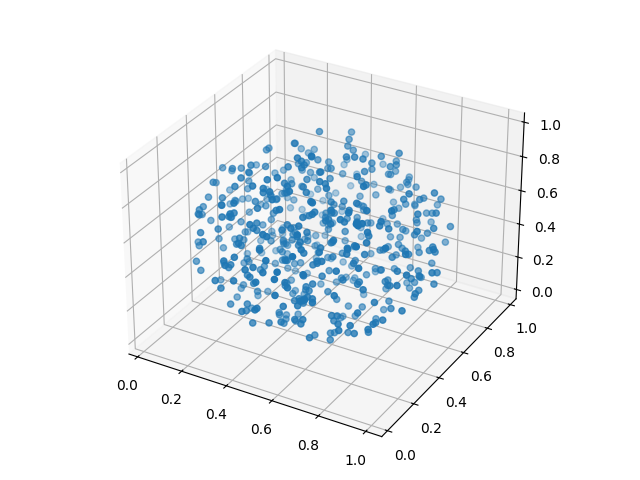
This will select all points which are inside a sphere with radius 0.5 and centered at (0.5, 0.5, 0.5):
selected_points = kp.math.spherecut([0.5, 0.5, 0.5], 0.0, 0.5, points)

fig = plt.figure()
ax = plt.axes(projection="3d")

ax.scatter(*selected_points.T)

fig.tight_layout()
plt.show()
Total running time of the script: (0 minutes 0.229 seconds)