Note
Click here to download the full example code
Local to Equatorial Coordinates
Where do my neutrinos come from?
# sphinx_gallery_thumbnail_number = 3

__author__ = "moritz"

import numpy as np
import pandas as pd
import matplotlib.pyplot as plt

from km3astro.coord import local_event, neutrino_to_source_direction
from km3astro.frame import get_location
from km3astro.plot import plot_equatorial
from km3astro.sources import VELA_X
Detector Coordinates
Let’s define some random events.
theta = 10 * np.pi / 180
phi = 8 * np.pi / 180
time = pd.to_datetime(
    [
        "2015-01-12T15:10:12",
        "2015-03-15T14:24:01",
    ]
).values[0]
Note:
Phi, theta: Where the neutrino is pointing to
Zenith, azimuth: where the neutrino is coming from
azimuth, zenith = neutrino_to_source_direction(phi, theta, radian=True)
We want to observe them from the Orca location. Let’s look at our geographical coordinates.
In km3astro, there are the predefined locations “orca”, “arca” and “antares”.
orca_loc = get_location("orca")
Create event in local coordinates (aka AltAz or Horizontal Coordinates)
This returns an astropy.SkyCoord instance.
evt_local = local_event(theta, phi, time, location="orca")

print(evt_local)
Out:
<SkyCoord (AltAz: obstime=[datetime.datetime(2015, 1, 12, 15, 10, 12)], location=(4659367.06359501, 491551.18803167, 4309636.59580957) m, pressure=0.0 hPa, temperature=0.0 deg_C, relative_humidity=0.0, obswl=1.0 micron): (az, alt) in deg
    [(259.97777407, -80.)]>
Transform to equatorial – ICRS
“If you’re looking for “J2000” coordinates, and aren’t sure if you want to use this or FK5, you probably want to use ICRS. It’s more well-defined as a catalog coordinate and is an inertial system, and is very close (within tens of milliarcseconds) to J2000 equatorial.”
evt_equat = evt_local.transform_to("icrs")
print(evt_equat)
Out:
<SkyCoord (ICRS): (ra, dec) in deg
    [(178.85803332, -43.65207584)]>
How far removed are these events from a certain source?
source_dist = evt_equat.separation(VELA_X)

plt.hist(source_dist.degree, bins="auto")
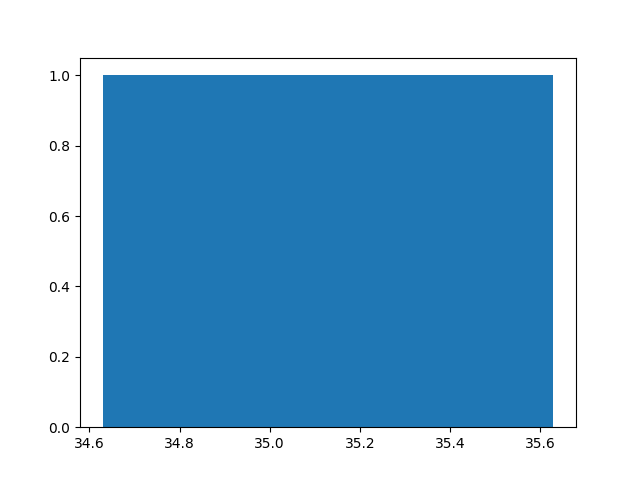
Out:
(array([1.]), array([34.62926186, 35.62926186]), <BarContainer object of 1 artists>)
Plot them in a square
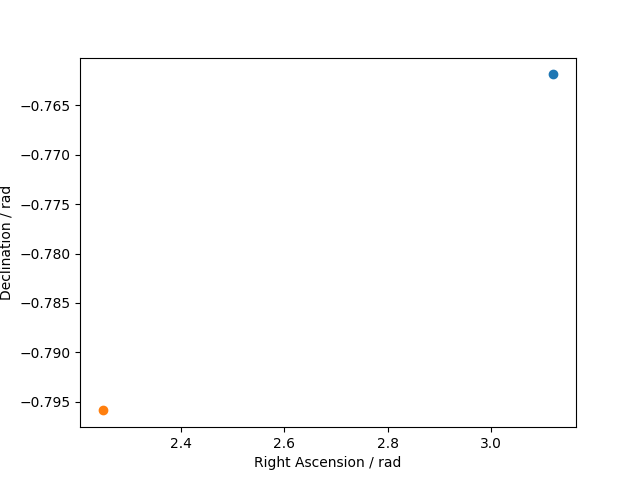
Out:
Text(13.597222222222216, 0.5, 'Declination / rad')
Plot them in a skymap.
We need this little wrap because astropy’s convention for ra, dec differs from matplotlib.
ax = plot_equatorial(evt_equat, markersize=12, label="Event")
plot_equatorial(VELA_X, markersize=12, ax=ax, label="Vela X")
plt.legend(loc="best")
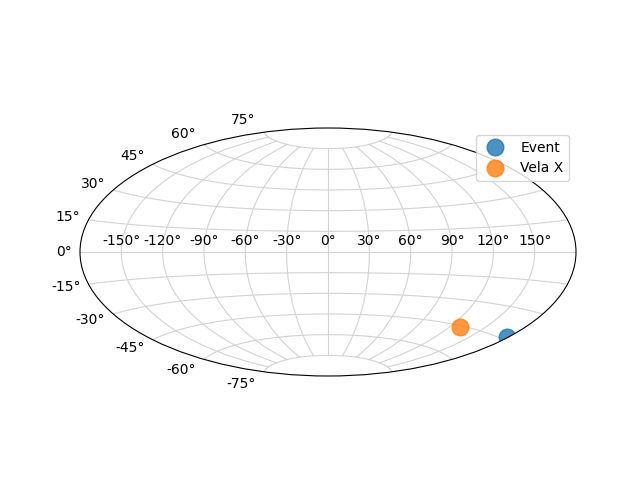
Out:
<matplotlib.legend.Legend object at 0x7f5b8fe7cb90>
Total running time of the script: ( 0 minutes 0.641 seconds)